
Click on the extract below to view data for each county in District 2.
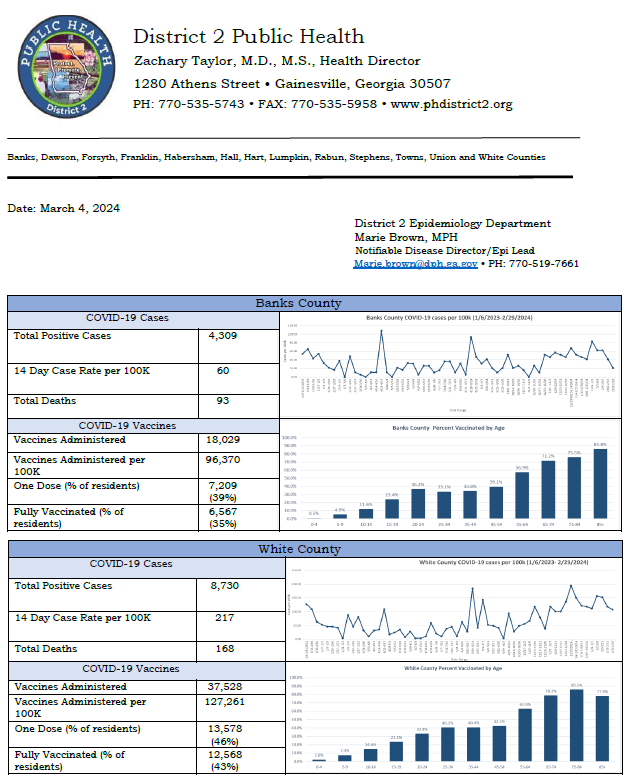
EPI SUMMARY: Data sources were Georgia DPH and SendSS. Cases include all confirmed and probable cases. Population data source was OASIS, 2022. Time frame as of 11/06/2020 to 2/29/2024. Vaccines introduced 12/19/2020—decline noted in cases after vaccine implementation. Vaccine data includes number of vaccines administered in each county in District 2 and vaccines administered per 100,000 (of the total county population). Vaccine data also shows number of one dose received and percentage of residents as well as 2 doses received, and percentage of residents vaccinated.
- Graph above shows weekly changes in COVID cases. The case rate reported in the graph is approximately half of the 14-day case rate.
- Vaccine graph shows percentage of individuals vaccinated by age group. Vaccine data last updated by State on 02/28/24.