Covid-19 Data as of April 11, 2022
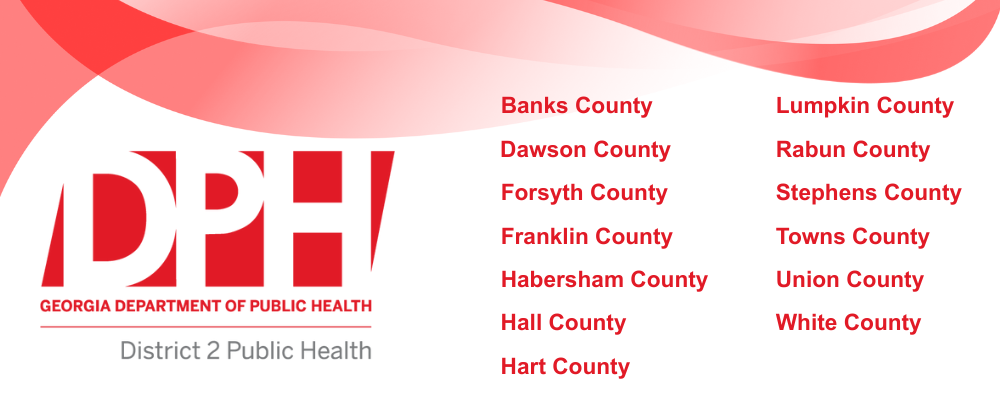
Click on the image below for information on all 13 counties in District 2. Graph above shows weekly changes in COVID cases. The case rate reported in the graph is approximately half of the 14-day case rate. Vaccine graph shows Continue reading Covid-19 Data as of April 11, 2022
