Week 5
(Week ending 02/07/2026)
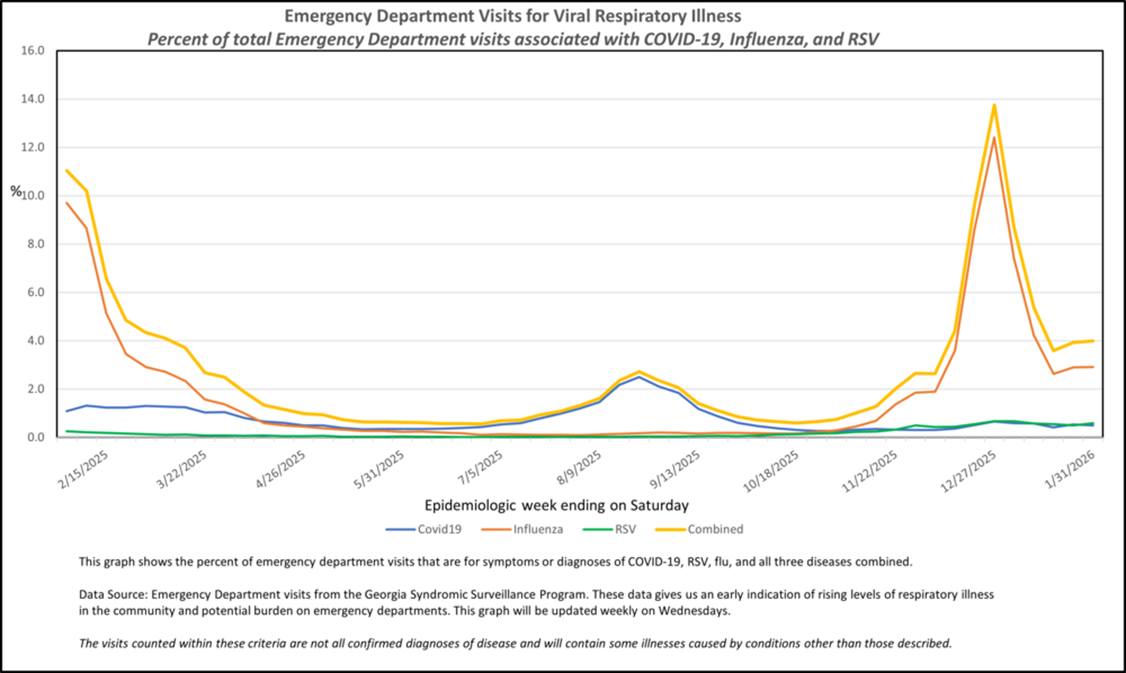
Pan-Respiratory Virus Surveillance (Georgia – Last Updated 02/11/2026)
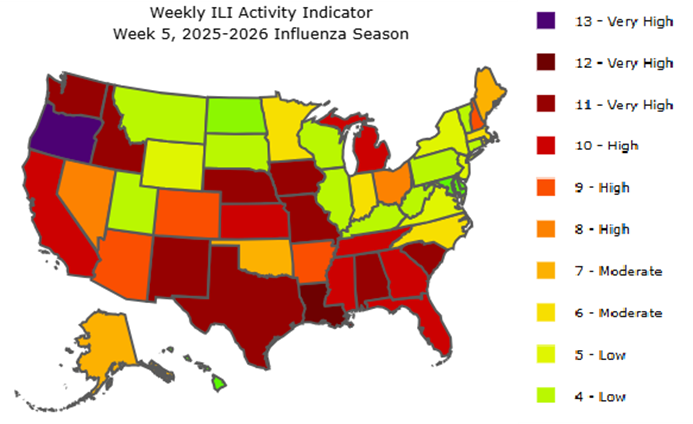
Georgia Flu Surveillance Update: Week 5 (Ending 02/07/2026)
As of Week 5, Georgia flu activity was high (10 on the scale of 1-13). Activity levels are based on the percent of outpatient visits in Georgia due to influenza-like illness (ILI) during this timeframe.
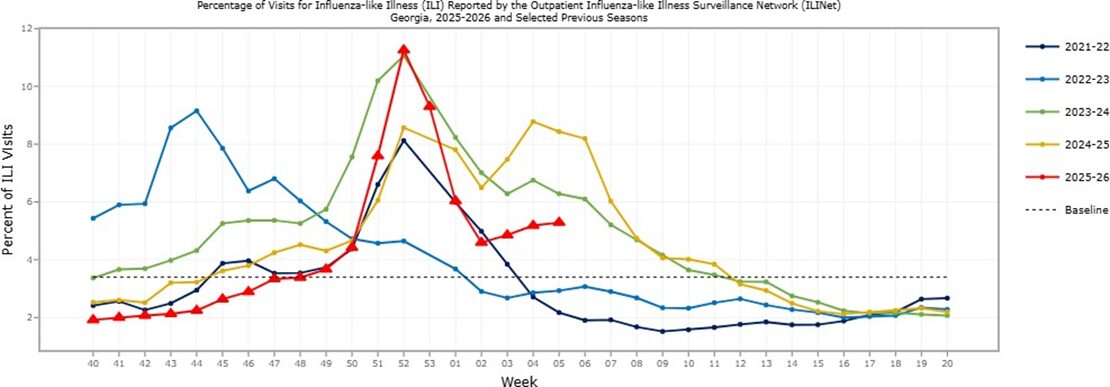
For the corresponding week, the percentage of outpatient visits for influenza-like illness was 5.3% (which is above the regional baseline of 3.4%), the number of influenza-associated deaths was 1 (167 total for the current ILI season); the number of Metro Area Influenza Hospitalizations was 83 (3,341 total for current flu season); and the number of influenza outbreaks was 10 (135 total for current flu season).
ILI (Influenza-Like Illness) Percentages by Season
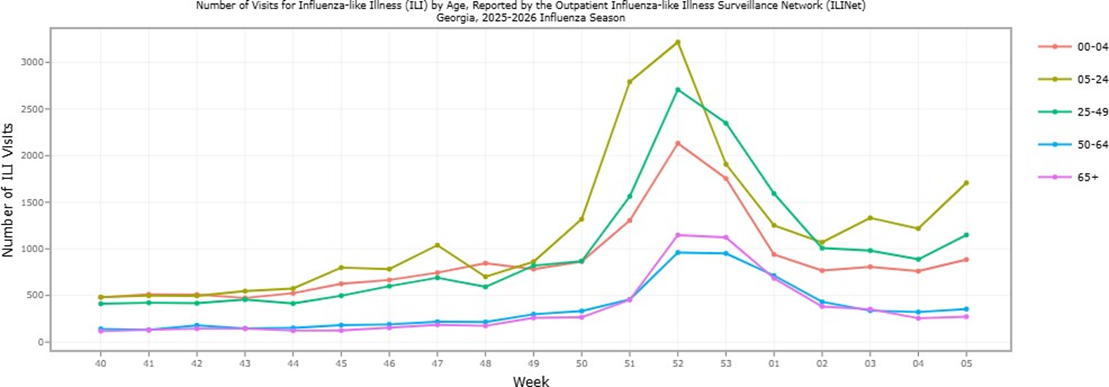
ILI (Influenza-like Illness) Percentages by Age
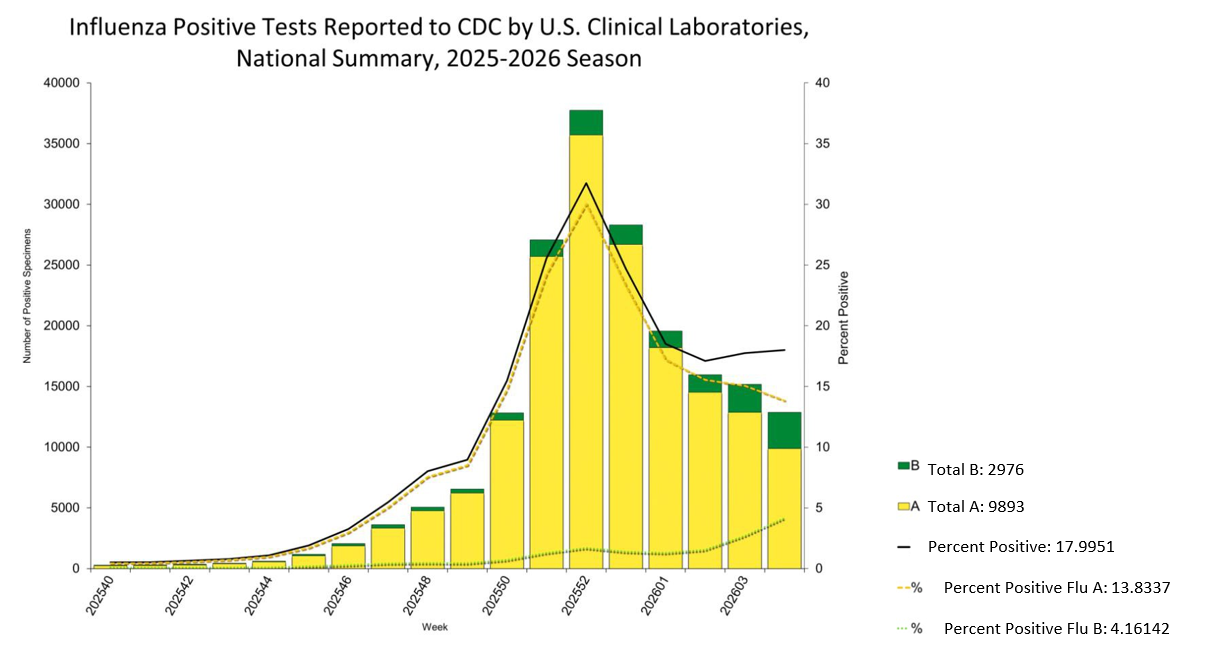
Influenza-Positive Tests Reported to CDC by Clinical Laboratories, HHS Region 4, 2025-2026 Season, Week Ending 01/31/2026*
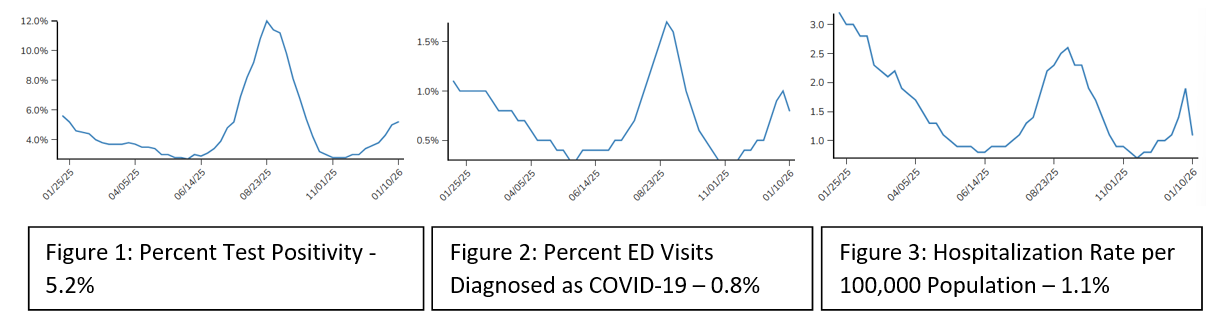
COVID-19 Snapshot (01/10/2026)*
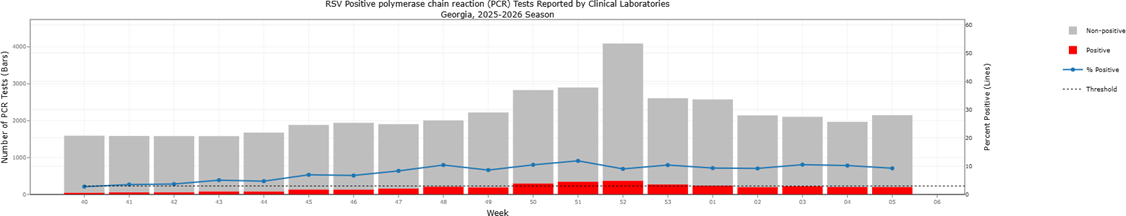
Respiratory Syncytial Virus Infection (RSV) Surveillance
Data from NREVSS are also analyzed to measure RSV seasonality. Antigen and polymerase chain reaction (PCR) tests are analyzed separately to determine the start and end of RSV season. Season onset is defined as the first week of two consecutive weeks when the percent positive of ALL laboratory confirmed tests are greater than or equal a certain threshold. The end is defined as the first week of two consecutive weeks when the percent positive of ALL lab confirmed tests are less than a certain threshold. For antigen-based testing, the threshold is 10% and for PCR the threshold is 3%.
During week 5, clinical laboratories in Georgia reported testing 4 (25% positive) antigen specimens and 2,150 (9.3% positive) PCR specimens.
*These graphs were last updated in January due to lapses in government funding.
Getting vaccinated is the best thing you can do to protect yourself and others.
District 2 health departments have vaccines available. Please contact your local health department for information on how to get your vaccine at http://phdistrict2.org/contact-us.
To learn more about how to protect yourself against flu and other respiratory diseases, visit DPH website at https://dph.georgia.gov/epidemiology/acute-disease-epidemiology/viral-respiratory-diseases and CDC website at https://www.cdc.gov/flu/
All Georgia physicians, laboratories, and other health care providers are required by law to report notifiable diseases. Instructions, including notifiable conditions and the timeframe in which they are reportable can be found at https://dph.georgia.gov/epidemiology/disease-reporting. Georgia tracks the listed conditions statewide using multiple overlapping surveillance systems, especially in the case of viral respiratory diseases as some are not reportable at the individual case level.